Problem to Solve
This project identifies the factors that influence the number of likes a song video receives on YouTube, allowing prediction of popularity based on musical characteristics and engagement metrics. The analysis uses a dataset with 28 variables that combine information from Spotify, YouTube, and musical composition properties.
Model used: Linear Regression
1. Dataset Information
The dataset contains information about Spotify songs and their corresponding videos on YouTube, with 28 variables including musical characteristics, engagement metrics, and metadata.
Categorical Variables (object)
- Artist: Artist name
- Url_spotify: Artist URL on Spotify
- Track: Song name as contained in Spotify
- Album: Album containing the song
- Album_type: Album type (solo or compilation)
- Uri: Spotify link to find the song in the API
- Url_youtube: Song video URL on YouTube
- Title: Video title on YouTube
- Channel: Name of the channel that published the video
- official_video: Boolean variable indicating if the video is official
- Description: Video description on YouTube
- Licensed: Indicates if the video is licensed
Numeric Variables (float64)
- Danceability: How suitable the song is for dancing
- Energy: Measure of intensity and activity
- Key: The key the track is in
- Loudness: The overall volume of the track in decibels (dB)
- Speechiness: Detects the presence of spoken words in the track
- Acousticness: Confidence measure to know if the track is acoustic
- Instrumentalness: Indicates if a track contains no vocals
- Liveness: Detects the presence of an audience in the recording
- Valence: Describes the musical positivity conveyed by a track
- Tempo: The overall estimated tempo in beats per minute (BPM)
- Duration_ms: Song duration in milliseconds
- Views: Views on YouTube
- Likes: Likes on YouTube
- Comments: Comments on YouTube
- Stream: Number of song plays on Spotify
Dataset Example
| Artist | Track | Album | Album_type | Danceability | Energy | Views | Likes | Comments | Stream |
|---|---|---|---|---|---|---|---|---|---|
| Gorillaz | Feel Good Inc. | Demon Days | album | 0.818 | 0.705 | 693,555,221 | 6,220,896 | 169,907 | 1.04e+09 |
| Gorillaz | Rhinestone Eyes | Plastic Beach | album | 0.676 | 0.703 | 72,011,645 | 1,079,128 | 31,003 | 3.10e+08 |
2. Exploratory Data Analysis (EDA)
An exploratory analysis was performed focused on answering three main questions about the factors that influence song popularity.
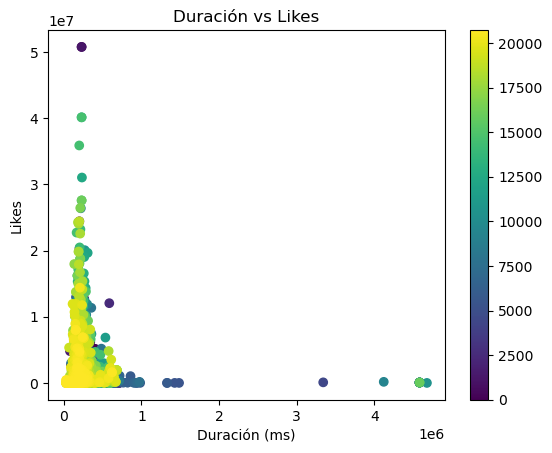
Is there a relationship between song duration and number of likes?
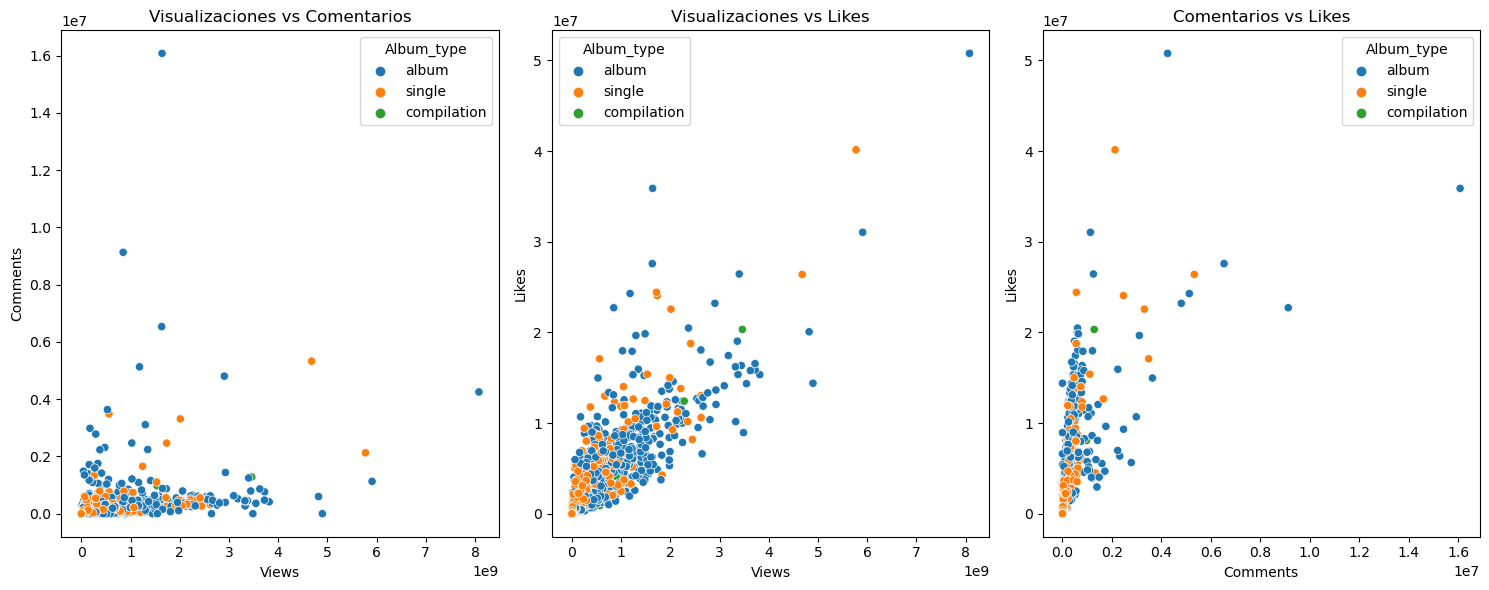
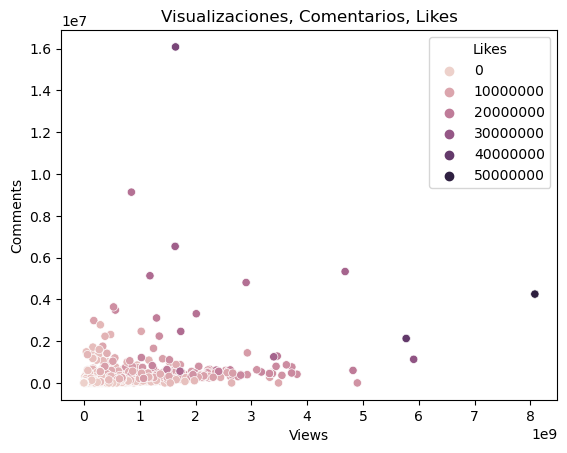
Is there a relationship between likes, comments, and views?
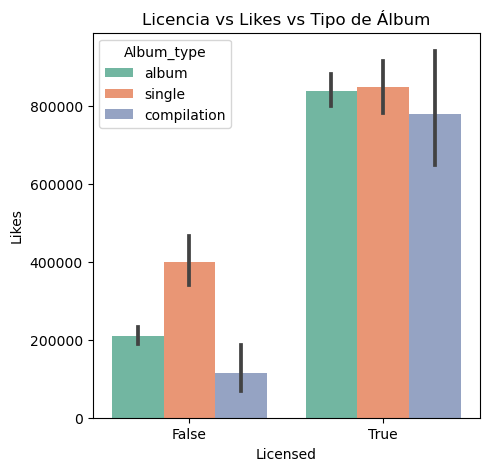
Does license influence the number of likes?
The relationship between video license status and their number of likes was analyzed to identify if this factor influences popularity.
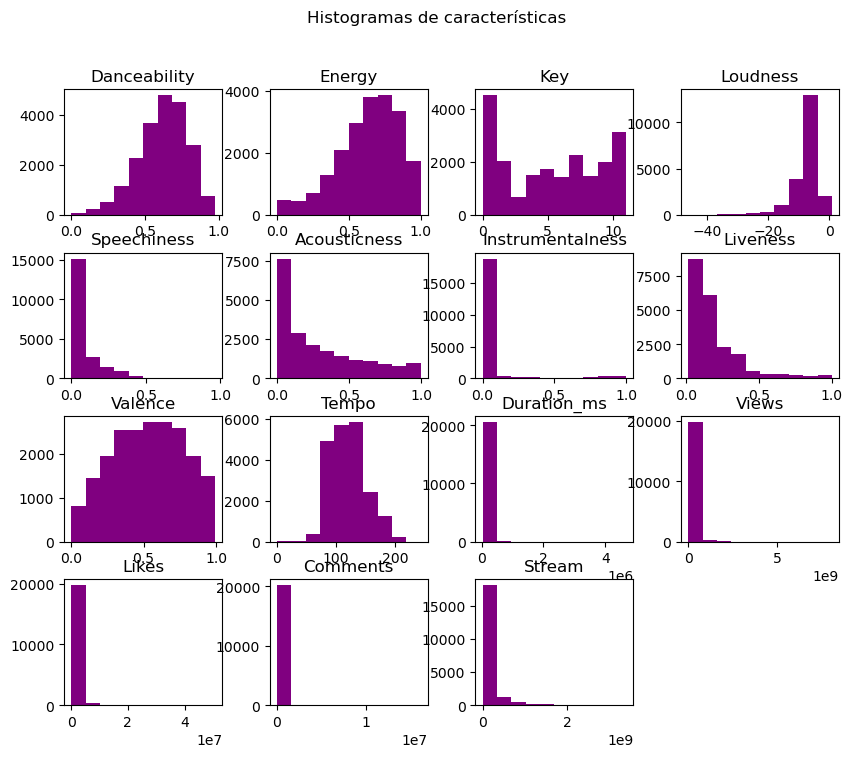
3. Normality Analysis of Numeric Variables
The distribution of numeric variables was analyzed to determine if they followed a normal distribution, which is crucial for deciding which imputation and scaling techniques to use.
4. Missing Data Treatment
Different imputation strategies were applied according to variable type and distribution:
Normal Variables
Missing data is replaced with the mean
Non-Normal Variables
Missing data is replaced with the median
Categorical Variables
Missing data is replaced with the mode
Implementation Example - Non-Normal Variables
imputador = SimpleImputer(missing_values=np.nan, strategy='median')
# non-normal variables are replaced with the median

transformados = imputador.fit_transform(variables_NOnormales)
# dataset transformation

missing_count = pd.DataFrame(transformados).isnull().sum()
print('The number of nulls in each column is:')
print(missing_count)
5. Outlier Treatment
Atypical values were identified and treated using different methods according to variable distribution.
Normal Variables - Z-Score
For variables with normal distribution, the Z-Score method was used to identify outliers. Values that are more than 3 standard deviations from the mean are considered outliers and are replaced with the mean.
Z-Score: z = (x - μ) / σ
If |z| > 3, then x is an outlier
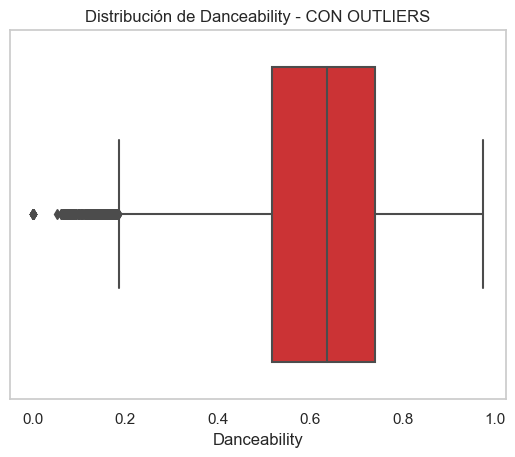
Non-Normal Variables - IQR (Interquartile Range)
For variables without normal distribution, the IQR (Interquartile Range) method was used. However, due to the large number of outliers found, it was decided to keep them in the dataset to preserve information.
IQR: IQR = Q3 - Q1
Limits: Lower limit = Q1 - 1.5×IQR
Upper limit = Q3 + 1.5×IQR
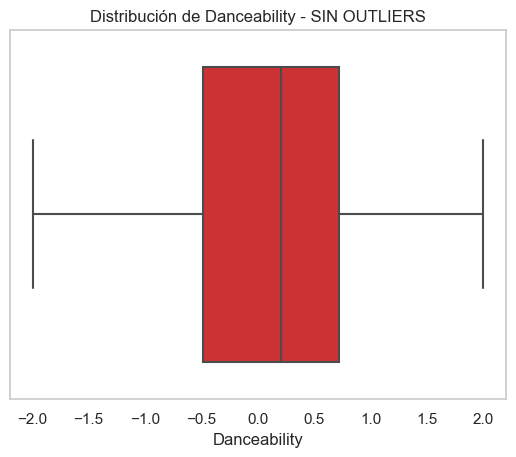
Visual Example - Danceability Variable
With Outliers
Without Outliers
6. Data Processing
6.1 Categorical Variable Encoding
LabelEncoder from scikit-learn was used to convert categorical variables into numeric values, allowing the model to process them.
Before Encoding
| Artist | Album_type | Licensed |
|---|---|---|
| Gorillaz | album | True |
| SICK LEGEND | single | True |
After Encoding
| Artist | Album_type | Licensed |
|---|---|---|
| 687 | 0 | 1 |
| 1234 | 2 | 1 |
6.2 Variable Scaling
Different scaling techniques were applied according to variable distribution:
Standard Scaler
For normal variables. Normalizes data by subtracting the mean and dividing by the standard deviation.
z = (x - μ) / σ
Robust Scaler
For non-normal variables. Uses the median and IQR, being more robust to outliers.
x_scaled = (x - median) / IQR
6.3 Correlation Analysis
The correlation map was analyzed to identify highly correlated variables and eliminate dependencies, avoiding the model having redundant information.
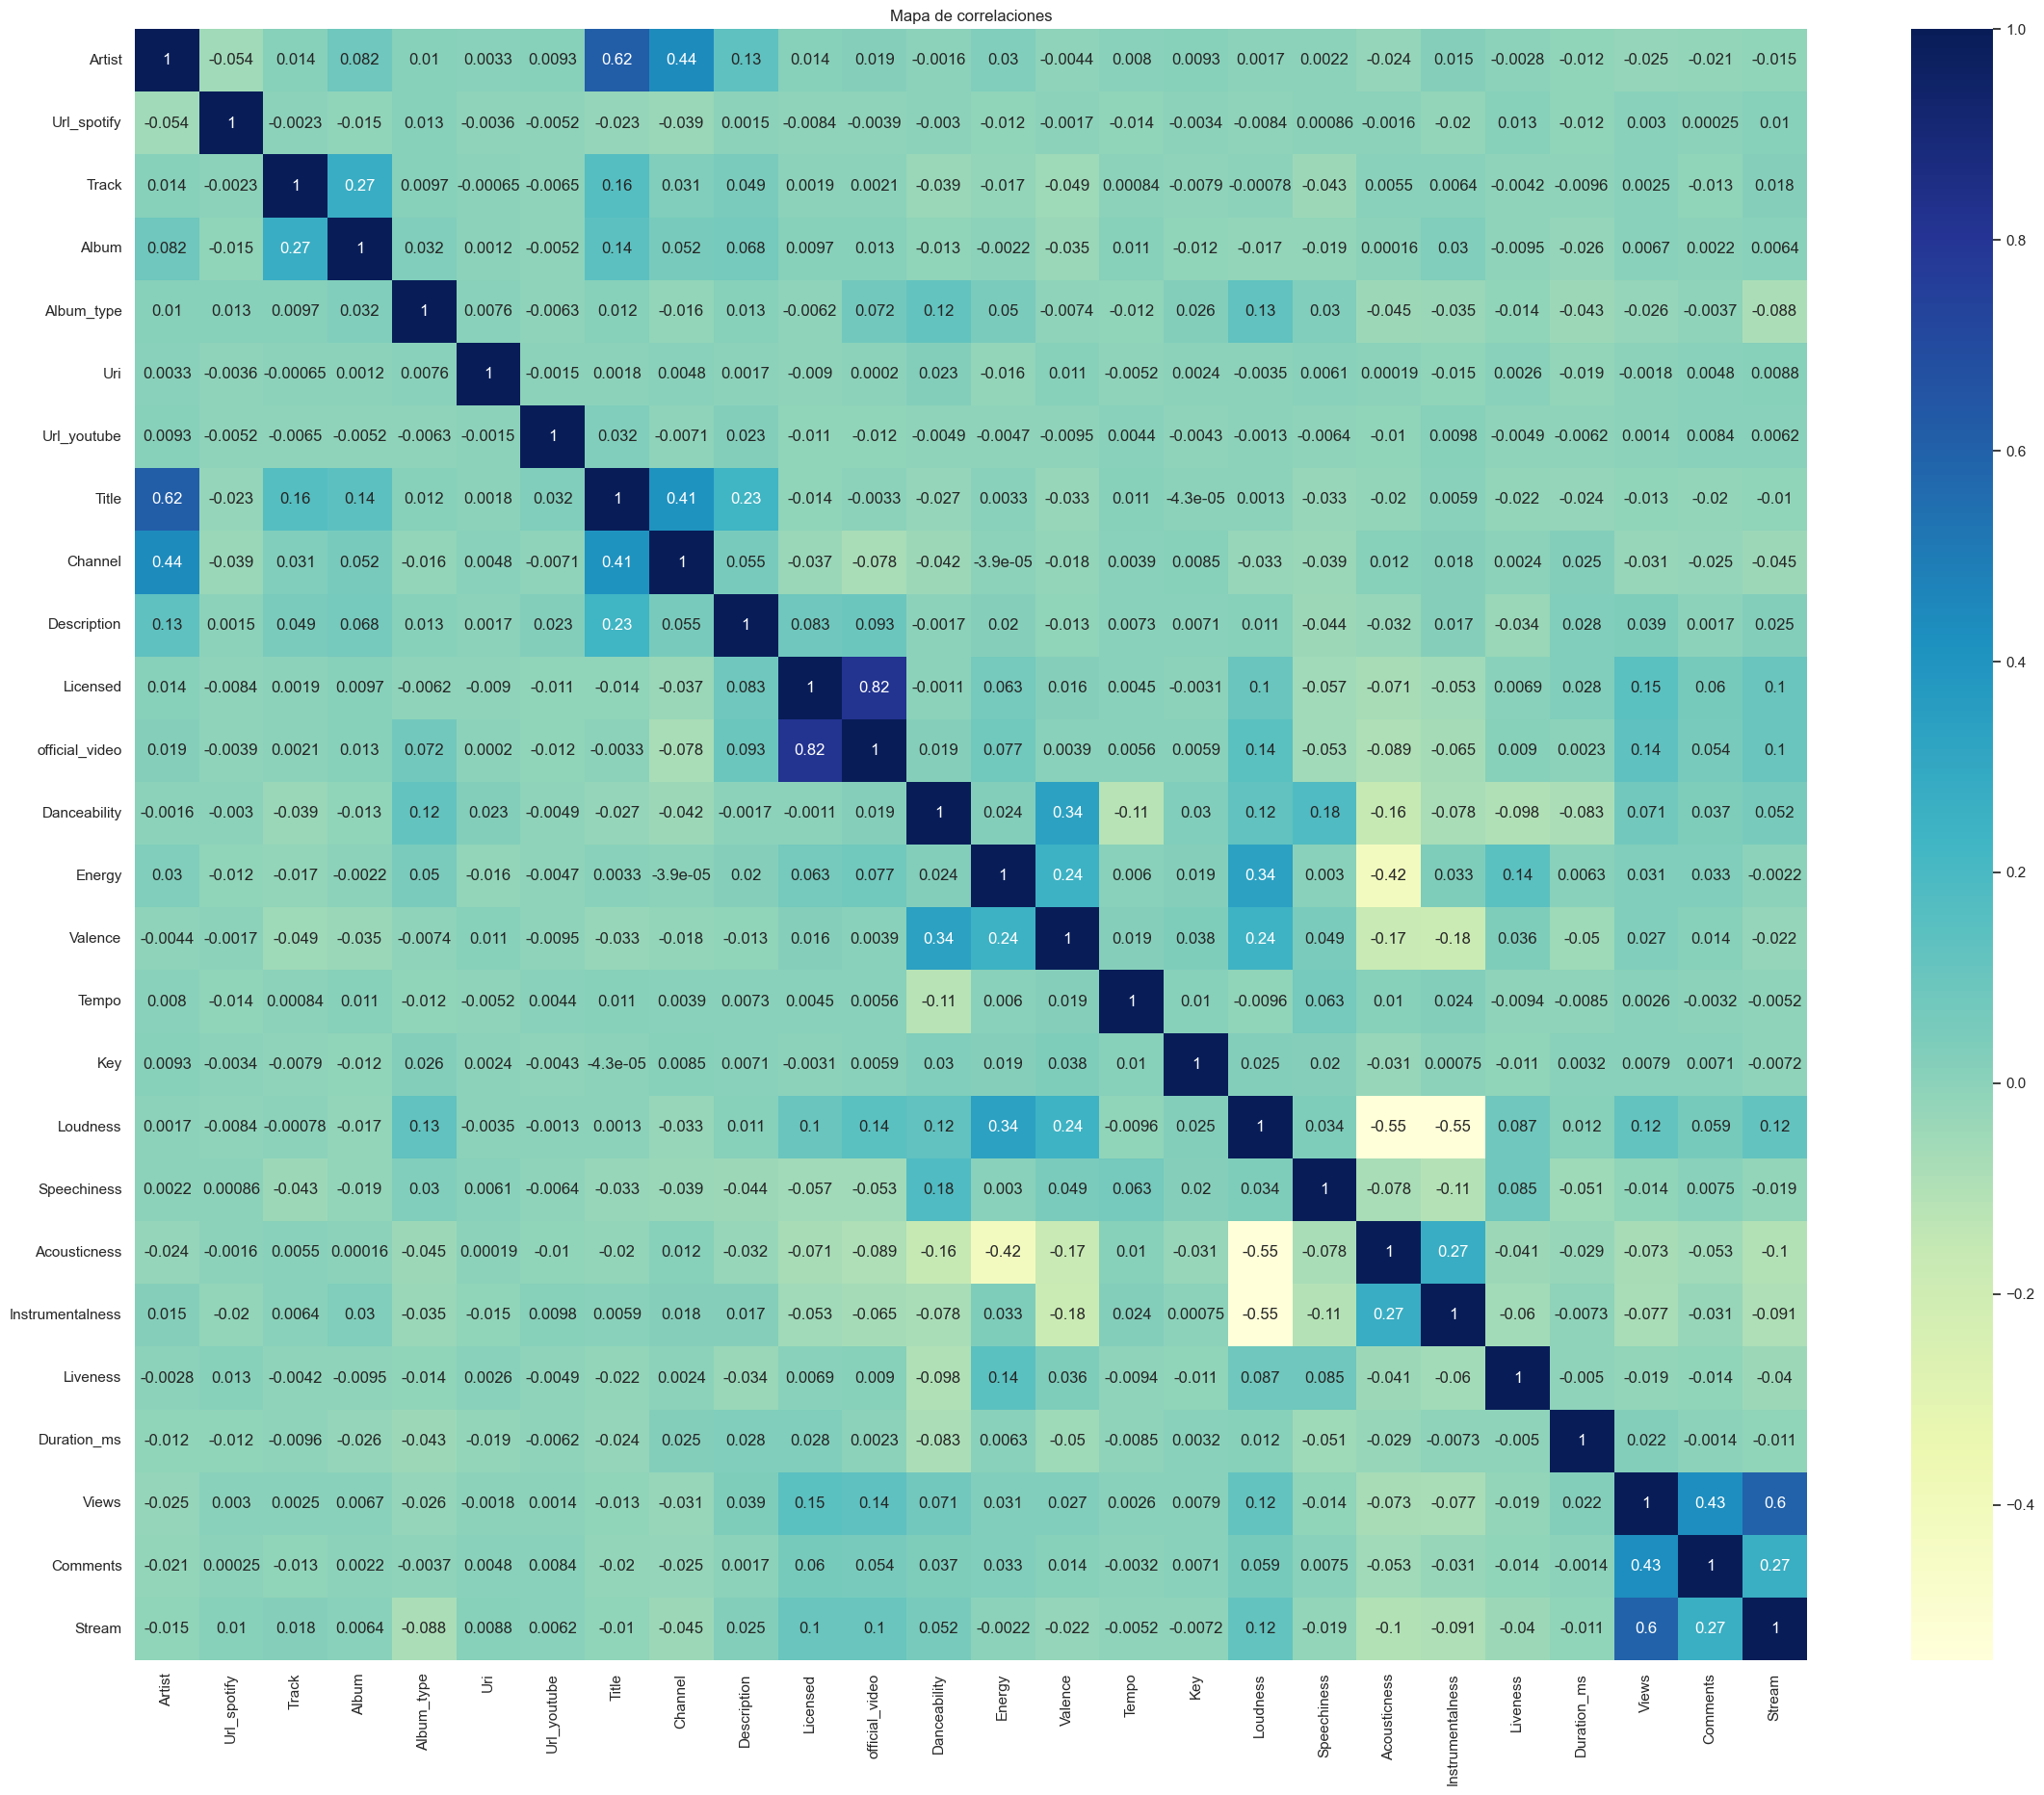
Variables with high correlation were eliminated to avoid multicollinearity in the linear regression model.
7. Model Results
A Linear Regression model was trained and its performance was evaluated using multiple metrics.
Most Important Variables
It was determined that the following variables are the most important for predicting likes:
Results Interpretation
The Linear Regression model achieved an R² of 0.87, indicating that 87% of the variability in the number of likes can be explained by the musical and engagement characteristics included in the model. This demonstrates that:
- Musical characteristics (danceability, energy, tempo, etc.) have a significant influence on video popularity
- Engagement metrics (views, comments, streams) are strongly related to likes
- The model is capable of predicting with good accuracy the number of likes a video will receive based on these characteristics